

Through Livelihood support change in status of life beneficiaries after one year of support
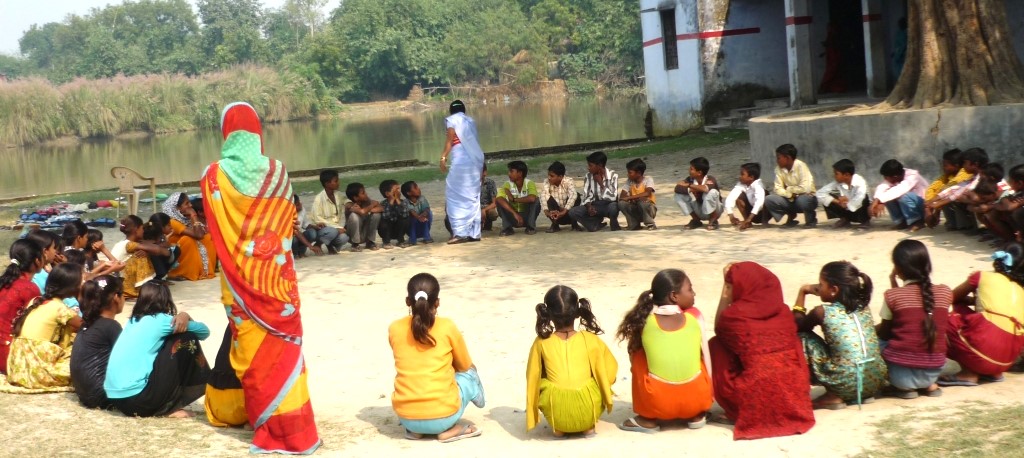
In our working area Azamgarh District livelihood support had been given to the 91 beneficiaries. Considering their social and Economic status they were provided support through livelihood. After completion of one year an assessment in the month of Sept.2019 was done to the change in their social and economic status. Data of all 91 families was collected through format by the coworkers. On the basis of collected data analysis was done which are as follows: -
Annual income
Status of the families | Annual income |
Income of 12% families is between |
|
Income of 31.5% families were between |
|
Income of 27% families were between |
|
Income of 4 % families were between |
|
Income of 18% families were between |
|
Income of 4% families were between |
|
Income of 2% families were above |
|
|
Loan Status of the families
Kind of support provided
Kind of support | Percentage of family |
Trolley | 18.5% |
Goat | 53% |
Shop/other | 6% |
Labour | 23% |
Status of the families after support
| Income of the families per year | percentage |
| Rs. 5,000 to 20,000 | 87% |
| Rs. 21,000 to 40,000 | 11% |
| Rs. 41,000 to 60,000 | 1% |
| Rs. 61,000 to 80,000 | 1% |
It is observed that about 87% families’ income has improved five thousand to twenty thousand per year and 11% families are between 21000 to 40000 per year. 41,000 to 60000 and 61000 to 80000 families’ income was increased only 1%.
Impact of support is seen only in those whose income are between 5,000 to 20,000. It is less because of fulfilling of other financial liability.
| Loan taken Yes or NO | Percentage |
| Yes | 56% families |
| No | 44% families |
It is observed that 56% families have taken loan even after our support but 44% had not takenloan because of support.
Description of taking loan: -
| Reason for taking loan | Percentage of families |
| 7% |
| 30% |
| 13% |
| 41% |
| 1% |
| 1% |
| 5.4% |
| 1% |
It seen that maximum 41% families were not taken loan because of support. Reason for taking loan 13% families have taken loan because of marriage for their daughters and 30% have taken to meet the dire medical emergency in the families and rest have taken for different -different needs.
| Percentage of the family | Increment in capital |
| 57% families | Yes |
| 10% Families | No |
| 33 % families | Undid |
57% families has accepted that after support their capital has increased however 10 % said No and 33% beneficiaries were found stable.
| Status of the families | Percentage |
| Bonded labor | 44% |
| Freed | 56% |
Before linking the program 44% bonded labor and 56% freed laborwere observed.
| Status of the family | Percentage |
| Bonded labour | 10% |
| Freed | 90% |
90% beneficiaries were found freed from bonded labor and only10% were found bonded labor. This improvement has seen because of awareness and support.
| Status of the child labour’s family | Percentage |
| Child labour | 21% |
| No child labour | 79% |
Before linking in the program 79% families had not child labor and 21% families had child labor in the family.
| Status of the child labor’s family | Percentage |
| Still having Child labour | 5% |
| No child labour | 95% |
After linking in the family there is only 5% child labor is found and 95% families have not child labor.
| Yes | 6 | 7% |
| No | 80 | 88% |
| Never | 5 | 5% |
Out of 91 beneficiaries 6 told that yes that they had been exploited, 80 said No they were not and 5 said that it was never been with them.
| No | 89 | 98% |
| Yes | 0 | 0 |
| Sometime | 2 | 2% |
Out of 91 beneficiaries only 2 have accepted that they are being torture sometime and 89 beneficiaries denied.
| No | 89 | 98% |
| yes | 2 | 2% |
Out of 91 beneficiaries 89 told that they had no fear and 2 beneficiaries accepted that they had fear.
| No | 87 | 96% |
| yes | 4 | 4% |
87 beneficiaries replied that they have not any fear whether 4 beneficiaries have accepted that they have fear.
| No | 46 | 51% |
| yes | 38 | 42% |
| Sometime | 6 | 7% |
| Never | 0 | 0 |
Opportunity to reach the business 51% said no they had not,42% beneficiaries told that they had opportunity ,7% beneficiaries told that they had but some time and 3 told that they had never.
| Yes | 50 | 55% |
| No | 31 | 34% |
| Sometime | 10 | 11% |
55% beneficiaries told that they have opportunity,34% told no they have not and 11% told that they have but some time.
| Yes | 25 | 27% |
| No | 50 | 55% |
| Very less | 16 | 18% |
27% beneficiaries replied that they had availability of capital,55% told they had not availability and 18% they had but very time.
| Yes | 38 | 42% |
| No | 30 | 33% |
| Very less | 23 | 25% |
42% beneficiaries replied that they had availability of capital,33% told they had not availability and 25% they had but very less.
| Yes | 40 | 44% |
| No | 51 | 66% |
Before linking with employment 44% families had benefits of govt schemes but 66% had not any benefits of govt. schemes.
| Yes | 68 | 75% |
| No | 23 | 25% |
After linking with employment 75% beneficiaries have benefits of govt. schemes however 25% beneficiaries have not benefits of govt. schemes.
| Type of house | Total number | Percentage |
| Cemented house- | 7 | 8% |
| Semi Cemented house | 11 | 12% |
| Mud House- | 73 | 80% |
Before linking with employment 8% beneficiaries had cemented house, 12% had semi cemented and 80% had mud house ( kaccha house).
| Type of house | Total number | Percentage |
| Cemented house- | 17 | 19% |
| Semi Cemented house | 13 | 14% |
| Mud House- | 61 | 67% |
After linking with employment 19% beneficiaries had cemented house, 14% had semi cemented and 67% had mud house ( kaccha house).
| Heads | Total number | Percentage |
| Health or Illness - | 51 | 56% |
| Marriage | 11 | 12% |
| Food and Education | 29 | 32% |
It is observed that 56% familieshad spent most over health and illness, 12% spent over marriage and 32% had spent over food and education.
| Heads | Total number | Percentage |
| Agriculture | 1 | 1% |
| Laboure work | 37 | 41% |
| Loan | 40 | 44% |
| Not known | 13 | 14% |
In response of the e above mention question 1% family replied that he would manage his by agriculture,41% replied that they would manage by doing Laboure work,44% would manage through loan however 14% families were not able say anything.
| Yes | 80 | 88% |
| No | 11 | 12% |
88% families are taking ration and 12% area not taking ration.
| Yes | 77 | 85% |
| No | 9 | 10% |
| N/A | 5 | 5% |
It is observed that 85% children below 14 year in the families are attending the school, 10% in families children are not attending school however among 5% families it is not applicable.
| Yes | 68 | 75% |
| No | 23 | 25% |
It is observed that 75% families are rearing cattle and 25% families don’t have cattle.
| Amount in Rs. | Number of the family | Percentage |
| 1000/- | 3 | 4.4% |
| 1500/- | 1 | 1.4% |
| 2000/- | 5 | 7% |
| 2500/- | 2 | 3% |
| 3000/- | 6 | 9% |
| 4000/- | 8 | 12% |
| 5000/- | 7 | 10% |
| 6000/- | 5 | 7% |
| 8000/- | 1 | 1.4% |
| 10,000/- | 9 | 13% |
| 12,000 | 2 | 3% |
| 15,000/- | 2 | 3% |
| 20,000/- | 7 | 10% |
| 25,000/- | 1 | 1.4% |
| 30,000/- | 3 | 4.4% |
| 40,000/- | 1 | 1.4% |
| Not known | 6 | 9% |
The above tables itself explanatory about the 68 families having cattle and their values. Most of the families having cattle between value of Rs. 1000 to 20000/- how ever very few families have cattle more than Rs.20,000 and 9% families were not able to tell the value of their cattle.
| Head of expense | Number families | Percentage |
| Construction of house | 21 | 23% |
| Health | 4 | 4% |
| Marriage | 41 | 45% |
| Admission of children | 6 | 7% |
| Education | 7 | 8% |
| Not known | 15 | 16% |
In response of asking about expenses in next five years 23% families told on construction of house,4% on health,45% on marriage,7% on admission,8% education of their children and 16% families were not able to tell anything about expenses.
| Govt. Schemes | families | percentage |
| House and Jan Arogya Yojana | 8 | 9% |
| House and labour registration | 5 | 5% |
| House, pension,Ayushman Bharat | 2 | 2% |
| House and Ayushman Bharat | 7 | 8% |
| House, Jan Arogya and Ration card | 6 | 7% |
| House ,job Card | 3 | 3% |
| House, Job card and Aushman Bharat | 2 | 2% |
| House Health, pension and job card | 5 | 5% |
| House jan Arogya and marriage | 4 | 4% |
| Job card Ayushman Bharat | 3 | 3% |
| Toilet and water supply | 4 | 4% |
| House | 30 | 33% |
| Ration card | 3 | 3% |
| Not Known | 5 | 5% |
After analyzing the data it is observed maximum 33% families are deprived from Awas Yojana (House) of govt.rest families are deprived from other schemes which are mention on table.
| Families | Numbers | Percentage |
| Yes | 22 | 24% |
| No | 42 | 46% |
| N/A | 27 | 30% |
In response above question 24% families are to provide job oriented education to their children, 46% families are not interested however 30% families are out of the criteria.
| Name of training | Number | Percentage |
| Mason | 15 | 68% |
| Plumber | 3 | 14 |
| Self employment | 4 | 18% |
68% families are interested in mason 14% are in plumber however 18% families are interested in self-employment with their traditional business.
| Yes | 70 | 77% |
| No | 14 | 15% |
| Not known | 7 | 8% |
In response of above 77% families said yes,15% said No and 8% families are not able to tell anything.
| Yes | 89 | 98% |
| No | 2 | 2% |
98% families have their Bank Account however 2% families do not have Bank Account.
| Yes | 55 | 61% |
| No | 12 | 13% |
| Sometime | 24 | 26% |
61% families are regular in depositing saving in their account, 13% families are not depositing however 26 families depositing but not regular basis.
| Yes | 62 | 68% |
| No | 12 | 13% |
| CVC | 17 | 19% |
68% families have member in SHG ,2% families have however 19% families said they have member in CVC.
Yes | 22 | 24% |
No | 69 | 76% |
24% members of the families had worked in MNREGA and 76% had not worked.
Yes | 27 | 30% |
No | 64 | 70 |
30% families said yes they will participate in forthcoming election however 70% families had denied that they will not participate.
Yes | 31 | 34% |
No | 60 | 66% |
34% families had accepted that there was migration in the family but 66% families said no there was no migration.
Yes | 18 | 20% |
No | 73 | 80% |
It is observed that 20% migration is still in the family however in 80% families there is no migration.
The above analysis has been done on the basis of data collected by the staff of ROSA to know facts of improvement of beneficiaries. It will give clear picture to us and that will help in further planning. This also a road map and to understand people in various aspects.
------------------------------------------------